Live Cloud Radar Map: Real-Time Satellite & Cloud Cover Tracker
A cloud radar map provides real-time satellite imagery to track cloud cover, storm density, and atmospheric shifts worldwide. Powered by high-precision ECMWF forecasting models, GoWeatherRadar delivers instant visual updates so you can plan outdoor events, stargazing, or travel with 100% confidence. Explore our live interactive map below to track local weather dynamics instantly!
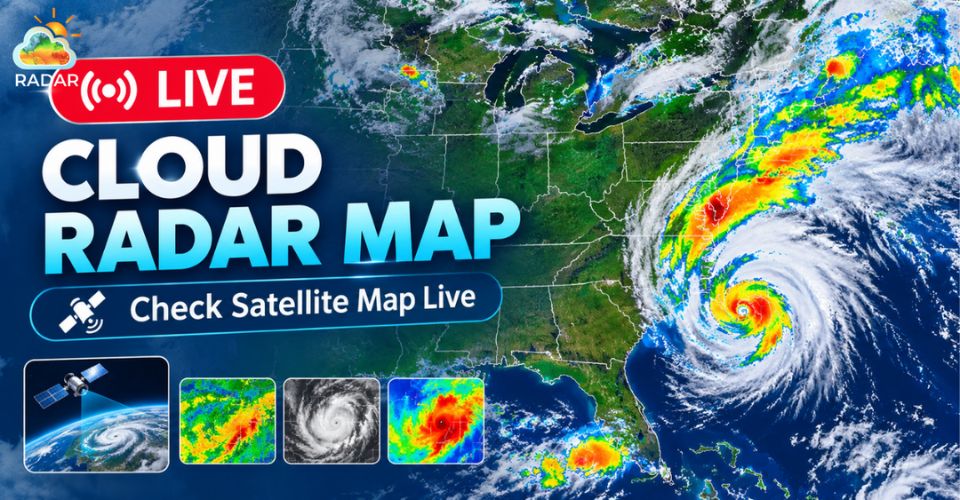
A cloud cover map is used to track cloud cover
What is Cloud Radar Map
A cloud radar map is an interactive meteorological visualizer that displays cloud cover, density, and movement across the globe in real time.
It combines satellite data and radar sensing into a dynamic map, letting you see exactly where clouds are gathering right now.
How It Works
Cloud radar mapping relies on advanced geostationary satellites and radar modeling to capture atmospheric conditions:
-
Visible (VIS) Satellite Sensors: Function like camera lenses in space during daylight hours. They capture sunlight reflecting off clouds, rendering realistic, high-resolution visuals of cloud shapes and coverage.
-
Infrared (IR) Thermal Sensors: Detect thermal radiation emitted from the atmosphere both day and night. Cooler readings indicate higher, thicker cloud tops, allowing continuous tracking around the clock.
-
Integrated Data Processing: On platforms like GoWeatherRadar, raw satellite imagery is combined with global forecast models - such as the ECMWF - to deliver smooth, real-time updates.
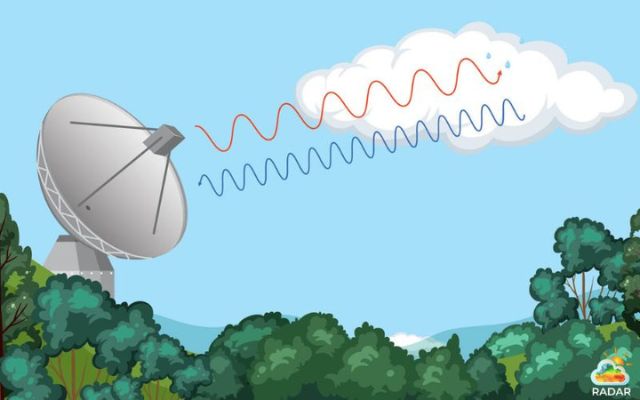
How does the cloud radar map work?
Key Use Cases
Tracking cloud patterns benefits a wide variety of activities:
-
Outdoor & Event Planning: Check if overcast skies will spoil beach trips, weddings, or weekend hikes.
-
Astronomy & Stargazing: Locate clear skies away from dense cloud blankets for unobstructed night views.
-
Aviation & Marine Navigation: Pilots and boaters monitor cloud ceilings, flight visibility, and sudden atmospheric shifts.
-
Severe Storm Tracking: Observe massive cloud formations that signal approaching cold fronts, tropical depressions, or severe rainstorms.
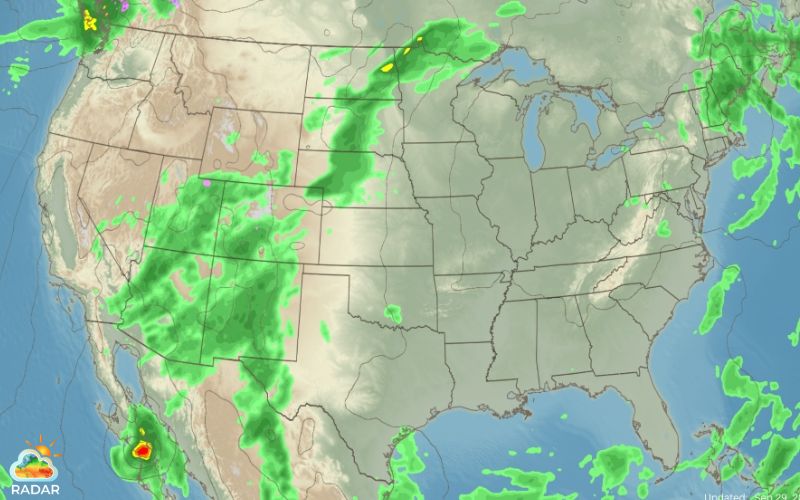
A cloud radar map is commonly used to track severe storms
How to Read a Cloud Radar Map
Navigating the interactive cloud radar on GoWeatherRadar is straightforward once you know how to interpret the map's visual layers and controls.
1. Understanding Color Legend & Cloud Density
When looking at the live map, color shading reveals the structure and density of the overcast:
-
Deep Blue to Light Blue Tint: Represents low-density or thin, high-altitude clouds (such as cirrus). Sky visibility remains relatively high with minimal shading on the ground.
-
Bright White to Cool Blue Shading: Indicates mid-level, moderately dense cloud layers (like altostratus). These bring noticeable overcast conditions, filtered sunlight, or light intermittent drizzles.
-
Vibrant Orange, Pink, to Deep Red Highlights: Signals thick, deeply developed convective clouds (cumulonimbus). These dense formations often signal incoming heavy downpours, lightning, or severe storm activity.
Check the Color Scale Bar anchored at the bottom edge of the map to gauge exact intensity metrics.
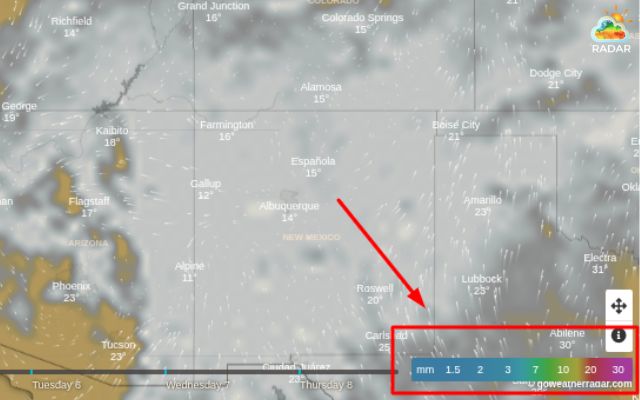
Color legend bar on cloud radar map on GoWeatherRadar
2. Switching Layers & Toggling Parameters
To view different weather factors alongside cloud coverage, use the Layer Control Panel located on the right side of the screen:
-
Click Clouds to focus purely on overcast density and upper-atmosphere movement.
-
Toggle Rain or Snow to see if current clouds are actively dropping precipitation.
-
Select Wind or Pressure to visualize the atmospheric currents pushing cloud systems across your area.
Tip: You can use the search bar at the top or tap the Target Icon on the left to auto-locate your current position instantly.
Read more:
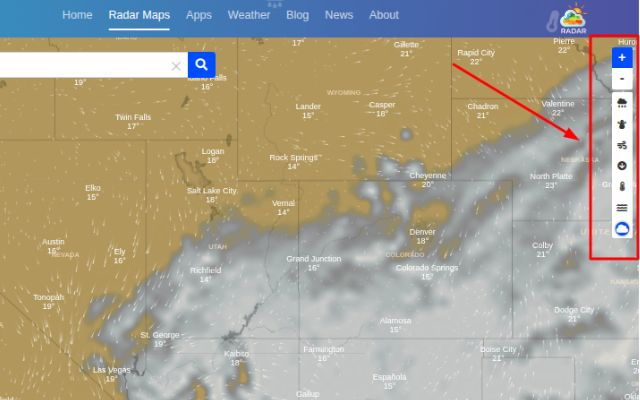
Use the Layer Control Panel to see different weather layers
3. Utilizing Animation Playback for Movement Direction
Static satellite maps only show current conditions. To track where cloud formations are heading, use the interactive Playback Timeline anchored at the bottom edge of the screen:
-
Track Cloud Trajectory: Watch the movement vector to determine whether cloud clusters are approaching or moving away from your local area.
-
Drag the Timeline Slider: Pause on specific timestamps or drag the playhead forward and backward to analyze the exact rate of cloud accumulation over time.
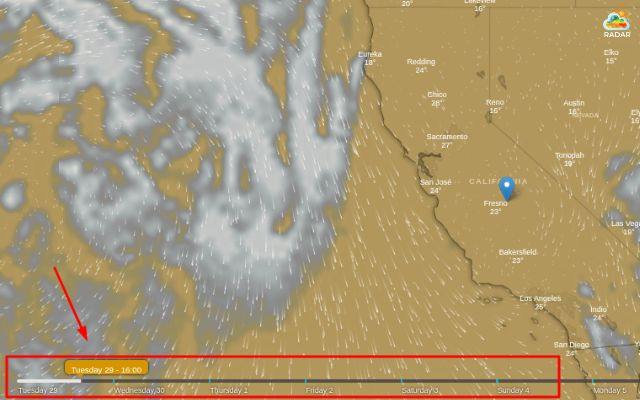
Take advantage of the timeline slider to analyze the cloud accumulation over time
Cloud Radar Map vs Rain Radar: What’s the Difference?
Though cloud and rain radar maps may look nearly identical on screen, they actually track two completely different weather phenomena.
Check out the comparison table below to see how they differ.
|
Feature |
Cloud Radar Map |
Rain/ Precipitation Radar |
|
Primary Data Source |
Space Satellites (Geostationary) |
Ground Doppler Towers |
|
What it detects |
Overcast, cloud density, cloud |
Droplets, ice particles, and active rainfall intensity |
|
Coverage area |
Global, including oceans and remote landmasses |
Local / Regional (limited by ground radar range) |
|
Best used for |
Global, including oceans and remote landmasses |
Checking immediate local rainfall in the next 1–3 hours |
Key Benefits of Using GoWeatherRadar for Cloud Tracking
When monitoring changing skies, speed and precision matter. GoWeatherRadar brings several key advantages to everyday weather checking:
-
Powered by Advanced ECMWF Forecasting: Uses data from the European Centre for Medium-Range Weather Forecasts, widely recognized as the gold standard in global weather modeling.
-
Real-Time Satellite Refresh Rates: Satellite frames update constantly every few minutes, providing near-instant visual tracking of changing cloud layers.
-
100% Free & No Subscription Barriers: Enjoy full access to global cloud maps, altitude layers, and loop animations without paywalls or forced account sign-ups.
-
Seamless Multi-Parameter Overlay: Combine cloud cover with wind vectors, air temperature, and humidity on a single interactive screen with one click.
-
Fast & Mobile-Friendly Performance: Optimized for smooth dragging, quick zooming, and minimal lag across desktop browsers, tablets, and smartphones.
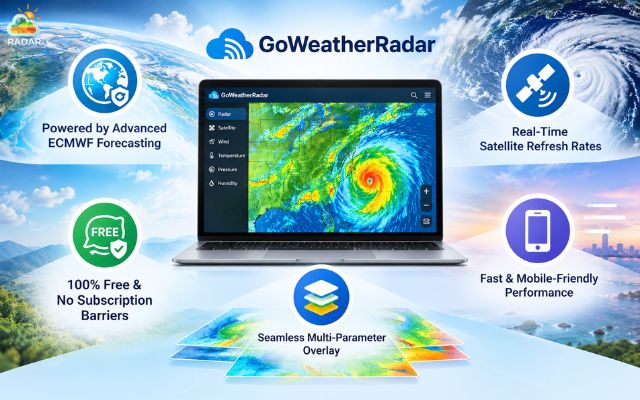
GoWeatherRadar’s cloud radar map is 100% free
Sum up
A cloud radar map is an essential tool for tracking live weather patterns, reading cloud density, and planning outdoor activities with ease. By leveraging GoWeatherRadar's high-precision satellite imagery and multi-parameter overlays, you can stay ahead of sudden atmospheric shifts. Bookmark our interactive radar today and never let unexpected cloud cover ruin your plans!
◉ Select a layer: Choose Radar for rain/snow or Clouds for satellite cover.
◉ Read colors: Green/white = light; Yellow = moderate; Red/purple = heavy storm.
◉ Hit Play: Click the timeline loop at the bottom to watch where the clouds or rain are moving.


0 Comments
Leave a Comment
Your email address will not be published. Required fields are marked *