Humidity Radar Map: Real-Time Tracking & How to Read It
Checked the forecast for mild weather, only to step outside and instantly feel sticky and drenched in sweat? A live humidity radar map reveals hidden moisture in the air in real time, powered by highly accurate ECMWF 9km satellite data. Read on to learn how to decode color layers, understand humidity levels, and easily stay ahead of muggy weather today!
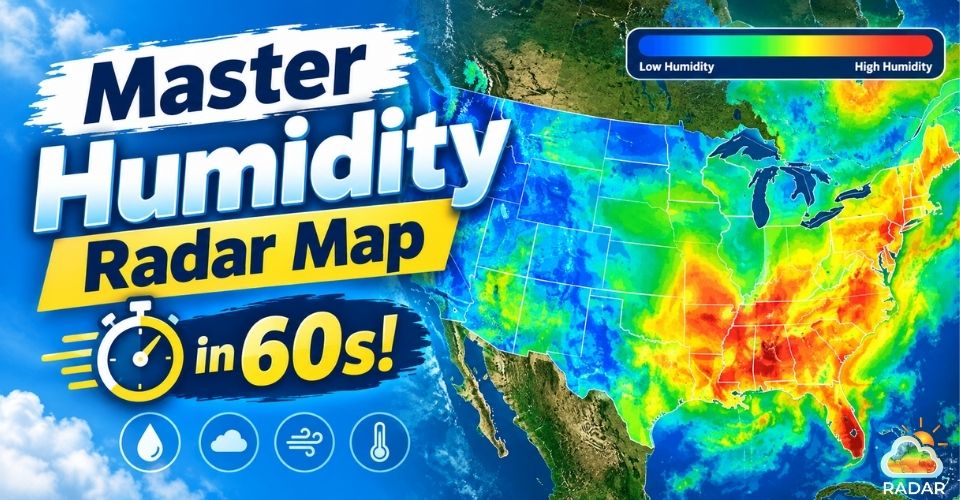
Master the humidity radar map
What is a Humidity Radar Map
A humidity radar map is an interactive visual tool that tracks moisture levels across the atmosphere in real time.
It provides a dynamic, color-coded map showing where air moisture is concentrating right now and where it is heading next.
Modern humidity radar maps rely on high-precision meteorological data.
They combine satellite observations, ground-based weather stations, and advanced forecast models, such as the ECMWF weather model to convert complex atmospheric measurements into clear, easy-to-read color layers.
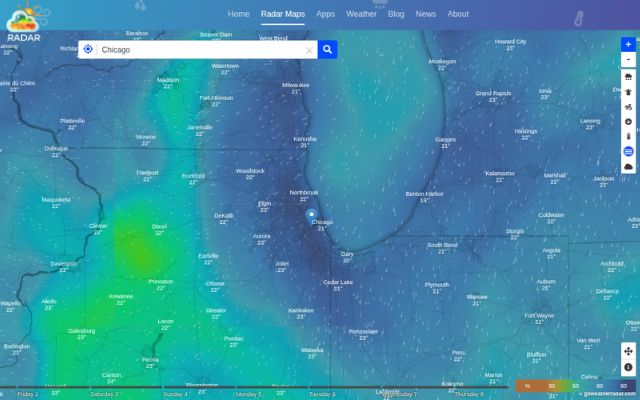
Humidity radar map on GoWeatherRadar
Why Track Humidity on a Radar Map?
Monitoring atmospheric moisture gives you a huge advantage over basic temperature forecasts:
-
Predict Rain and Fog Early: Air usually reaches maximum moisture saturation before rain or heavy fog develops. Tracking these moisture surges helps you spot incoming precipitation earlier than traditional rain radar.
-
Assess True Thermal Comfort: High humidity traps body heat, making warm days feel scorching. Checking the radar helps you evaluate the actual Heat Index—how hot the air really feels on your skin.
-
Plan Outdoor Activities Wisely: Whether you are scheduling a morning run, preparing outdoor events, or managing agricultural work, real-time humidity tracking keeps you ahead of muggy, uncomfortable conditions.
Key Elements of a Humidity Radar Map
To get the most out of a humidity radar, you only need to understand two main components: the color legend and the difference between relative humidity and dew point.
Understanding the Color Legend
The humidity radar map uses an intuitive color spectrum to represent moisture concentration.
As you zoom in or move across regions, keep these color cues in mind:
-
Yellow to Light Orange (Low Humidity — 30% or lower): Indicates dry air masses. These conditions feel crisp and comfortable in warm weather, but prolonged exposure can cause dry skin or throat irritation.
-
Green to Emerald (Moderate to High — 50% to 80%): Represents typical to noticeably humid air. Green zones feel pleasant in cool weather, but as levels climb toward 80%, the air starts to feel sticky and muggy.
-
Deep Blue (Near Saturation — 90% to 100%): Highlights air that is holding near-maximum water vapor. When you see these dark shades on the map, expect heavy cloud cover, dense fog, or imminent rainfall.
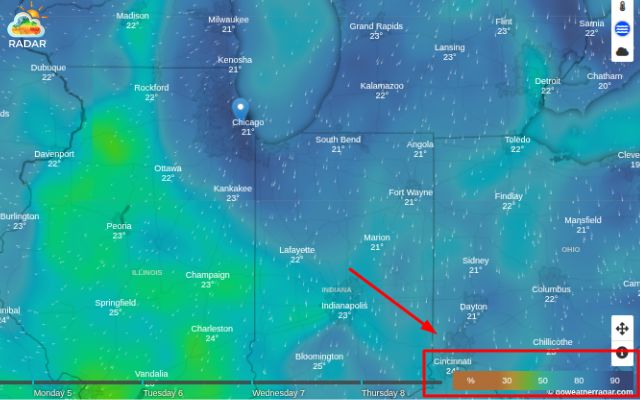
Color cues in a humidity radar map
Relative Humidity (%) vs. Dew Point
While both metrics measure moisture, they tell slightly different stories about your weather environment:
Relative Humidity (%)
Relative humidity measures how much water vapor is currently in the air compared to the maximum amount the air could hold at its current temperature.
-
30% or below: Dry air.
-
50%–60%: Ideal, comfortable levels for most daily activities.
-
80%–100%: Fully saturated air; rain or fog is likely occurring nearby.
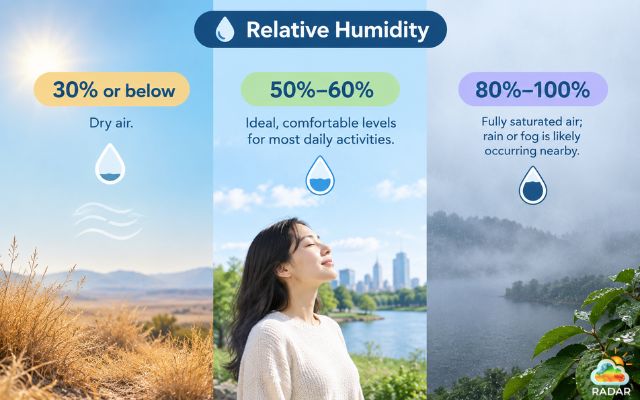
Relative humidity is used to forecast rain, fog, and storms
Dew Point
Dew point is the exact temperature to which air must cool to become fully saturated with water vapor.
Meteorologists prefer dew point because it does not fluctuate with daily temperature swings.
A higher dew point directly signals stickier, more oppressive air regardless of what the thermometer says.
Discover more:
How to Read a Humidity Radar Map on GoWeatherRadar
To read a humidity radar map on GoWeatherRadar, you just need to navigate to GoWeatherRadar Map, select the humidity layer, and decode the moisture spectrum.
Now let’s dive into our step-by-step guide!
Step 1: Search and Pinpoint Your Location
Start by finding your local area or destination. Use the search bar in the top-left corner to type in your city name (such as "California").
Alternatively, click the location icon to let the map automatically detect your current coordinates.
Pro Tip: Use the + and - buttons on the screen, or scroll with your mouse to zoom out for a broad regional view or zoom in for neighborhood-level details.
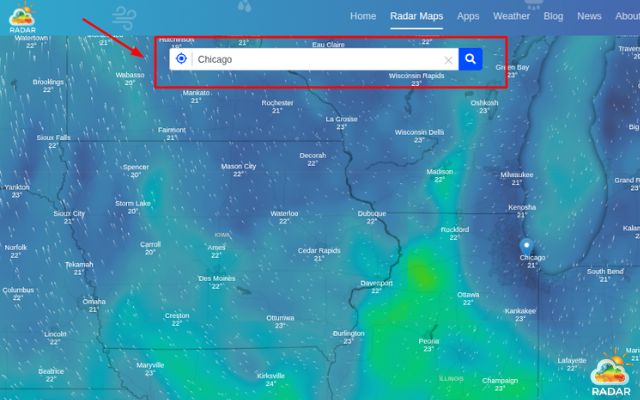
Search the areas where you want to check the humidity
Step 2: Switch to the Humidity Overlay Layer
GoWeatherRadar offers multiple weather layers, including rain, wind, and temperature.
To view atmospheric moisture, open the layer selection menu on the right sidebar and select the Humidity icon (%).
The map will instantly update to display color-coded humidity patterns across your selected area.
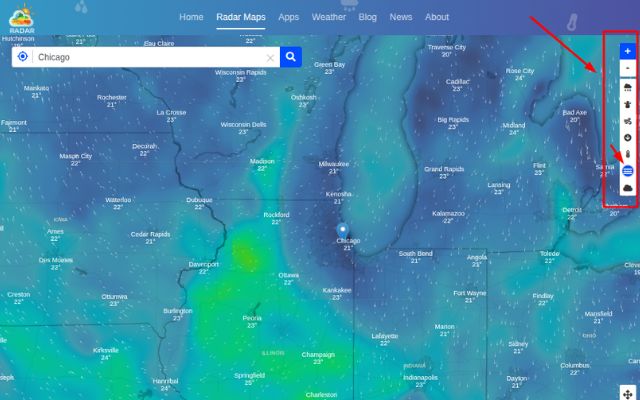
Select the humidity layer on the right sidebar
Step 3: Analyze Colors and Check Live Percentages
Look at the color overlay across your region and cross-reference it with the color legend bar at the bottom right:
-
Yellow to Orange (Around 30%): Signals dry air masses with lower moisture content.
-
Green to Emerald Green (50%–80%): Indicates moderate to high humidity levels, moving from comfortable conditions to a noticeably muggy atmosphere.
-
Deep Blue (90%–100%): Shows heavily saturated air, pointing to high chances of dense fog, heavy cloud cover, or imminent rain.
Want exact numbers? Click any spot on the interactive map to pop up a pin drop displaying the precise latitude, longitude, and live relative humidity percentage for that specific location.
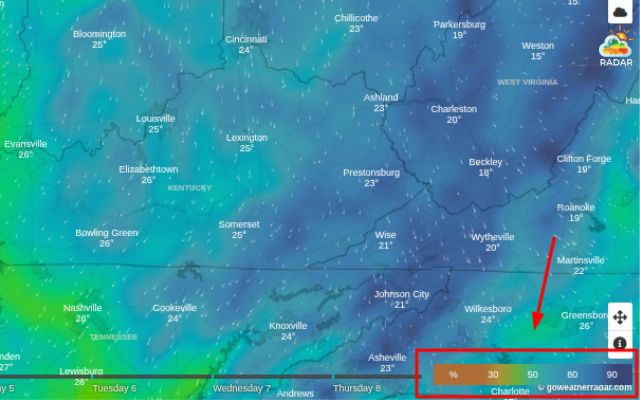
Check the color legend bar to scan the humidity in the area
Step 4: Use the Timeline Player to Forecast Trends
GoWeatherRadar powers its forecasts using the highly accurate ECMWF 9km model, shown in the bottom-left info panel.
Drag the timeline slider forward to see whether humid air is approaching or if a drier front will clear up your area later in the day.
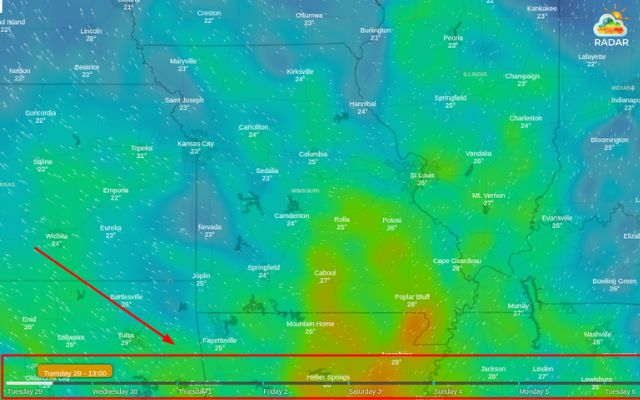
Drag the timeline slider to see the humidity forecast
Step 5: Customize Your Settings and Share the Map
Tailor the display to fit your preferences by clicking the Settings (gear icon) in the main menu:
-
Weather elements unit: Easily switch measurement units across temperature (°C vs. °F), wind speed (mph, km/h, knots), and rain or snow accumulation (in, mm).
-
Timezone: Toggle between local time (such as GMT +7:00) and UTC.
-
Time Format: Switch between 12-hour and 24-hour clock views.
-
Share Map: Click the Share button to quickly copy a custom URL pinned to your exact coordinates, zoom level, and selected humidity view - perfect for sending to friends, family, or colleagues.
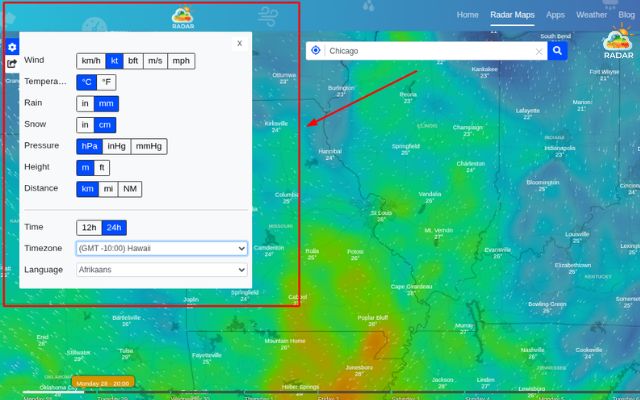
Customize the display to fit your preferences
Sum up
Monitoring a humidity radar map is the smartest way to track real-time atmospheric moisture, predict sudden rain, and evaluate true thermal comfort. By mastering color legends, relative humidity levels, and dew points on GoWeatherRadar, you can easily plan outdoor activities and stay one step ahead of muggy, unpredictable weather every day.
◉ Color Legends: Green and light blue indicate light rain/moisture; yellow, orange, and purple represent heavy rain, storms, or severe air saturation.
◉ Fronts and Lines: Blue lines with triangles show cold fronts (bringing rain or cooler air), while red lines with semi-circles show warm fronts.
◉ Isobars: Concentric lines showing atmospheric pressure; lines packed closely together signal strong winds.


0 Comments
Leave a Comment
Your email address will not be published. Required fields are marked *