Rain Radar Map: Track Precipitation & Storms Near You
Need a rain radar map to track incoming storms in real time? Over 80% of sudden weather disruptions can be avoided with live Doppler precision. Discover how to accurately read precipitation movement, decode color intensities, and predict rain in your area within minutes. Read on to master our interactive map and stay one step ahead of the weather!
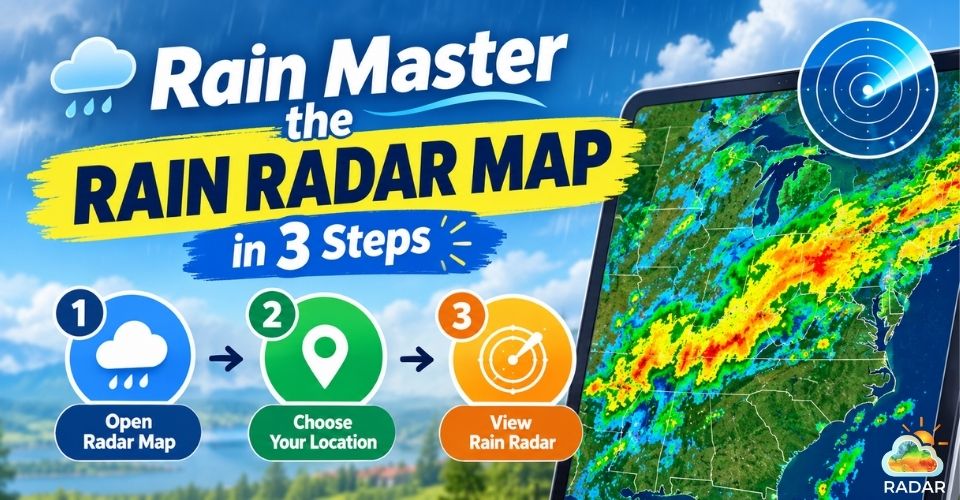
Master the rain radar map in minutes
What is a Rain Radar Map & How Does It Work
A rain radar map is an interactive visual tool for tracking real-time weather. It maps radar signals to show live rain, snow, hail, and storms on a map.
(Read more: Snow radar map)
Instead of relying on traditional mathematical forecast models, it uses live radar reflections. This shows you exactly where rain is falling right now and where it will head next.
How Doppler Radar Tracks Weather in Real Time
Modern weather tracking relies on Doppler radar technology. Here is how the magic happens behind the scenes:
-
Emitting Signal Pulses: Ground radar stations send invisible radio waves into the atmosphere.
-
Bouncing Off Water Droplets: When these waves hit rain, hail, or snow, they bounce back to the antenna.
-
Measuring Echo Strength & Delay: The system measures signal travel time and strength. A stronger signal means heavier rainfall.
-
Calculating Motion (Doppler Shift): By tracking frequency shifts in the returning waves, the radar calculates storm speed and direction.
This entire process repeats every 5 to 10 minutes, generating a continuous loop of fresh weather imagery.
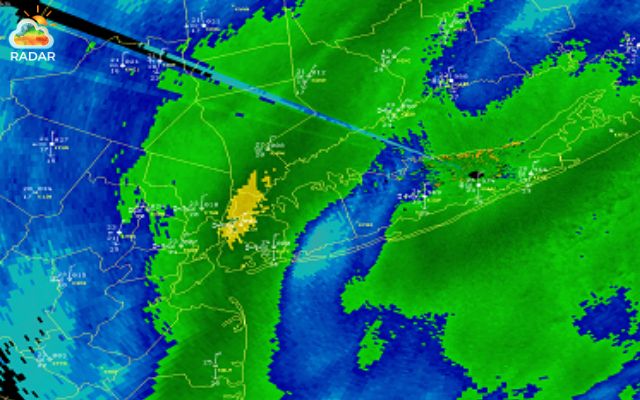
Ground stations send out radar waves that bounce off rain droplets
Why You Need a Rain Radar Map
Why do millions of outdoor enthusiasts, commuters, and pilots check live radar daily?
Here is why it beats standard weather apps:
-
Hyper-Local Precision: Get rain updates for your specific neighborhood instead of a broad city average.
-
Instant Nowcasting: Access accurate forecasts for the next 1 to 3 hours. Perfect for timing your commute or outdoor plans.
-
Severe Weather Warnings: Spot incoming hail, heavy downpours, and severe storms early so you can stay safe.
-
Smarter Travel Planning: Check highway routes in real time to avoid dangerous driving conditions and rain delays.
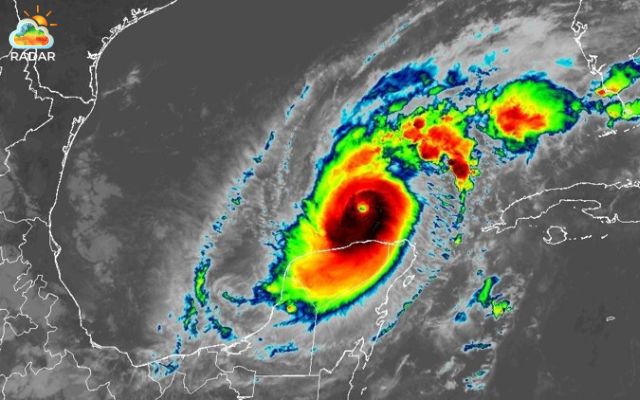
Doppler radar map used to track hurricanes
Understand Precipitation Colors & Movements
Rain radar maps use a standard color scale to show rainfall intensity.
Colors range from light blue for drizzle to deep purple for severe storms, reflecting standard radar energy values (dBZ).
The Color Scale Index
Let’s take a look at this table to understand how radar colors helps you!
|
Radar Color |
Precipitation Type |
Rainfall Intensity |
DBZ Range |
Expected Conditions |
|
Light blue/Green |
Light Rain / Drizzle |
< 2.5 mm/hr |
15-30 dBZ |
Damp roads, light mist, umbrella optional |
|
Yellow/Orange |
Moderate to Heavy Rain |
2.5 - 16 mm/hr |
35-45 dBZ |
Steady downpours, low visibility, reduced driving speed |
|
Red/ Purple |
Torrential Rain / Severe Storms |
> 16 mm/hr |
50-65 + dBZ |
Flash flooding, lightning, hail, damaging winds |
|
White/ Pink |
Frozen Precipitation |
Varies |
Special Echoes |
Snow, sleet, or freezing rain |
Radar Movements
Colors tell you how hard it is raining, but movement tells you when it will arrive. When viewing an animated radar loop, keep two distinct movement patterns in mind:
-
Individual Cell Growth: Notice how colorful patches expand or shrink over time. A rapidly expanding red core means a thunderstorm is gaining strength right above that spot.
-
Directional Drift: Track the overall trajectory of the rain cluster across the map grid. Storms usually follow upper-level wind currents, moving in predictable paths from west to east in many global regions. (Read more: Wind radar map)
By checking rain colors and movement direction, you can easily predict when rain will reach your area.
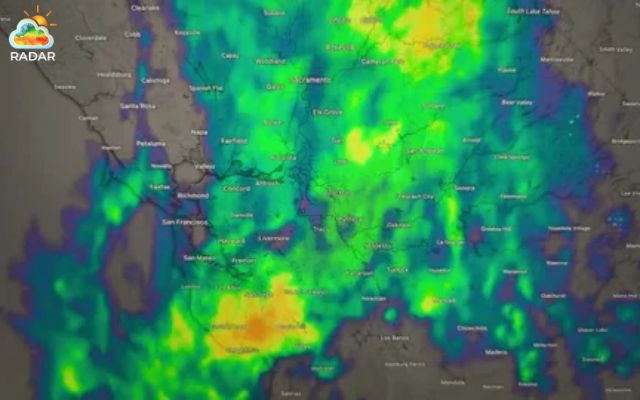
Radar loops show storm movement over time, helping you predict when rain will hit
How to Read a Rain Radar Map on GoWeatherRadar
Reading a live map on GoWeatherRadar is simple once you know the basic controls.
Follow these four steps to track real-time rain, storm strength, and movement near you:
Step 1: Pinpoint Your Location & Enable GPS
When you open GoWeatherRadar, the map centers on your location automatically.
If auto-location is disabled, you can simply search for your city or zip code using the top search bar.
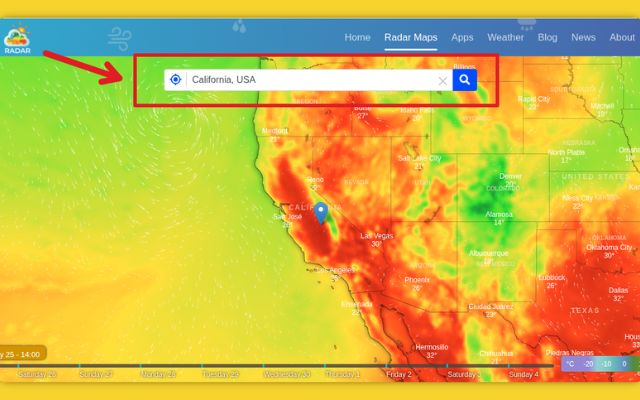
Type your city or zip code into the search bar to focus the map on your exact area
Step 2: Select the "Rain / Precipitation" Layer
GoWeatherRadar offers several map layers, like wind and temperature. Make sure you select the rain layer to track precipitation:
-
Navigate to the Layer Menu (usually located on the right side or top-right corner of the map).
-
Select Rain to display live precipitation data.
Tip: Switching to this layer removes extra weather data, letting you focus only on rain intensity and movement.
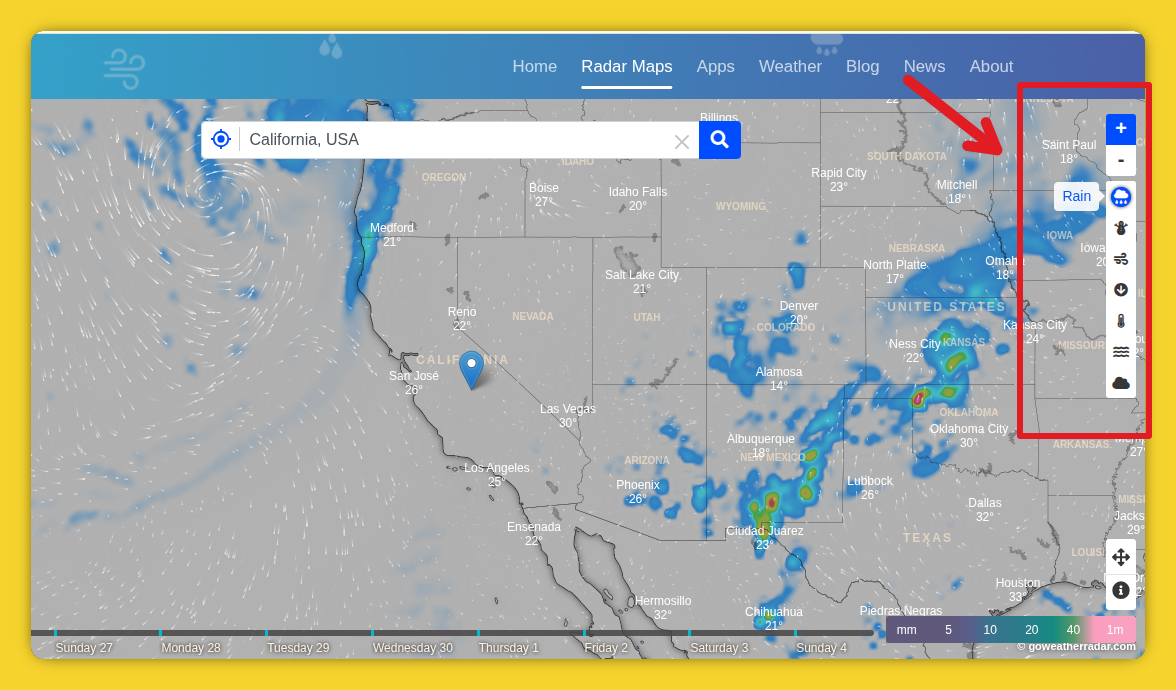
Enable the rain radar layer on GoWeatherRadar to view real-time precipitation tracking
Step 3: Decode Rain Intensity Using the Color Legend
Once the rain layer is active, color-coded echoes will appear over the map.
Reference the color scale legend at the bottom of the screen to judge the severity of the rainfall:
-
Light Blue / Light Green: Light rain, drizzle, or passing showers.
-
Dark Green / Yellow: Moderate rainfall; expect noticeable wet conditions.
-
Orange / Red: Heavy rain and strong convective thunderstorms.
-
Purple / Pink: Intense downpours, potential hail, or severe squall lines.
Note: Color scales may vary slightly between platforms. While most apps use green-to-red for light-to-heavy rain, always check the map’s on-screen legend for exact values.
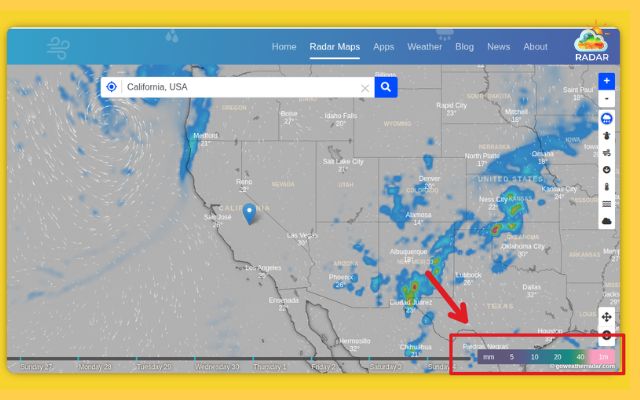
Check the on-screen color key to identify light showers versus heavy thunderstorms nearby
Step 4: Use the Timeline Controls to Track Storm Movement
To see where the rain is heading and when it will hit your area:
-
Observe the direction and speed at which the rain clusters are drifting.
-
Scrub the slider forward to view short-term nowcasting predictions for the next 30 to 60 minutes.
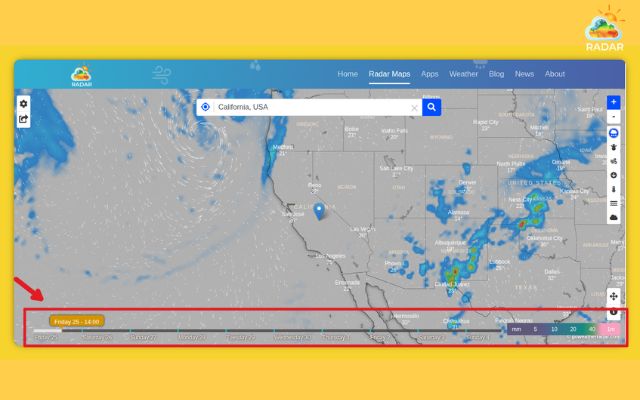
Scrub the slider forward to view short-term nowcasting
Rain Radar Map vs. Traditional Weather Forecast: Key Difference
A rain radar map tracks real-time rainfall using live radar reflections. In contrast, traditional weather forecasts predict future conditions using computer models.
Combining both gives you the most complete picture of local weather conditions.
|
Feature |
Rain Radar Map (Doppler) |
Traditional Weather Forecast |
|
Primary Data Source |
Ground-based radio wave reflections |
Computer models (GFS, ECMWF) & satellites |
|
Time Horizon |
Real-time to 3 hours (Nowcasting) |
24 hours to 14 days ahead |
|
Geographic Precision |
Hyper-local (Neighborhoods/street level) |
Regional or city-wide average |
|
Update Frequency |
Every 5 to 10 minutes |
Every 3 to 12 hours |
|
Best Used For |
Immediate outdoor decisions, storm tracking |
Planning ahead for the week or weeknd |
Sum up
A reliable rain radar map is your best defense against unexpected downpours and sudden severe storms. By understanding color intensities and tracking live movement patterns on GoWeatherRadar, you can confidently plan outdoor activities and travel routes. Check your local live map today and stay one step ahead of the weather!


0 Comments
Leave a Comment
Your email address will not be published. Required fields are marked *