Snow Radar Map: How to Track Live Snowfall and Read Weather Radar
A snow radar map is your most critical tool for tracking live snowfall and staying ahead of severe winter storms in real time. Analyzing high-resolution ECMWF data across major weather platforms, this complete guide breaks down color intensity scales, storm trajectories, and practical tips to keep you safe. Dive in now to master reading snow radar maps like a pro!
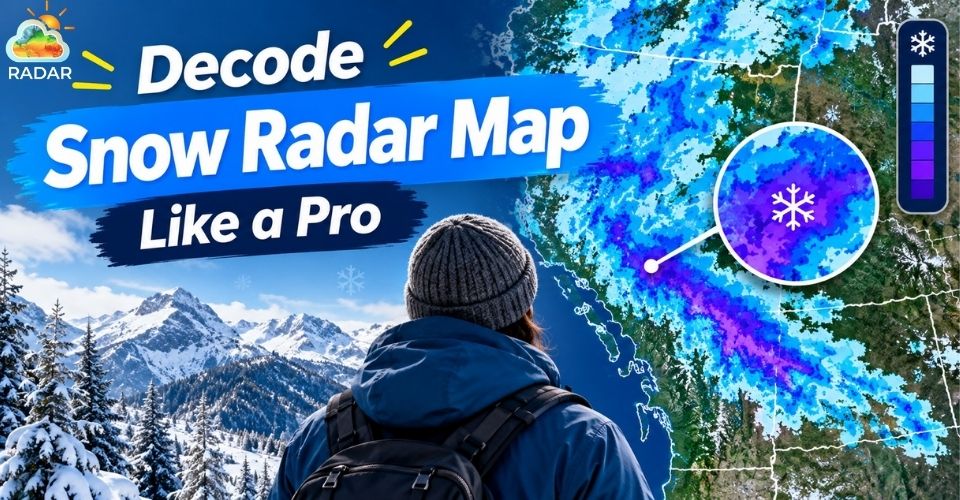
Learn how to read a snow radar map easily
Understanding Snow Radar Map
A snow radar map is an interactive, real-time weather tool that uses Doppler radar technology to detect, track, and visualize snowfall location, direction, and intensity.
By displaying precipitation data through a color-coded visual layer, it allows users to monitor approaching winter storms, estimate local snow accumulation, and make safe travel decisions.
What is a snow radar map
A snow radar map translates complex atmospheric data into a simple, visual display you can check on your phone or desktop.
A live radar map shows you exactly where the snow is falling right now and where it is heading over the next few hours.
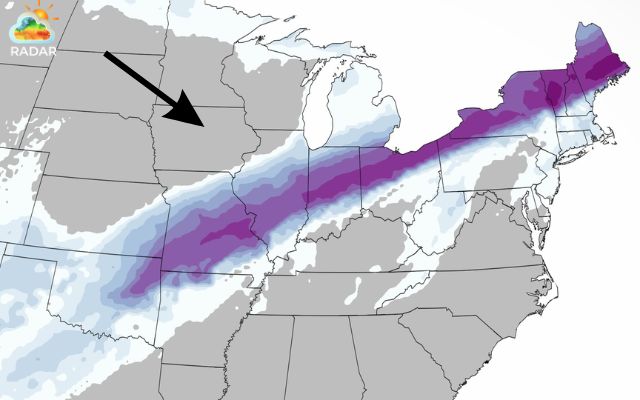
Example of a snow radar map
The Science Behind It: Doppler Radar Mechanics
Snow radar relies heavily on Ground-Based Doppler Radar stations (such as the NEXRAD network in the United States). Here is how the scanning mechanism works:
-
Pulse Emission: The radar antenna sends out rapid pulses of electromagnetic microwave energy into the atmosphere.
-
Precipitation Reflection: When these waves hit snowflakes, ice crystals, or raindrops, a portion of that energy bounces back to the radar station.
-
Echo Analysis: The radar calculates the time it took for the wave to return and measures the signal's energy (reflectivity). This tells meteorologists precisely how far away the snow is and how dense the precipitation cloud is.
-
Doppler Effect: By measuring frequency shifts in the returning signal, the radar determines whether the snow storm is moving toward or away from your location, as well as its exact speed.
Snow Radar Map: Colors and Intensity
Understanding the color legend on your weather screen is the key to reading any snow radar map correctly.
Different colors correspond directly to reflectivity levels, which indicate how heavily snow is falling.
-
Light Blue (Flurries / Light Snow): Indicates light snowfall or scattered flurries. Visibility remains relatively good, and snow accumulates very slowly (typically less than 0.5 inches per hour).
-
Dark Blue to Purple (Moderate to Heavy Snow): Represents steady, dense snowfall. When purple appears, expect rapidly deteriorating road conditions, high wind gusts, and low visibility. Snow accumulation can exceed 1 to 2 inches per hour.
-
Pink to Orange (Sleet / Freezing Rain / Mixed Precipitation): Signals a hazardous mix of melting snow, ice pellets, or freezing rain. Pink and orange zones often mark the warm front boundary where snow transitions into dangerous ice accumulation.
You may also like
Reflectivity Scale: Converting dBZ to Snow Accumulation
Meteorologists measure radar return signal strength in dBZ (Decibels of Z). The higher the dBZ value, the heavier the precipitation.
The table below breaks down how dBZ values translate to color codes and actual snowfall rates:
|
Radar color code |
dBZ Range |
Precipitation Type |
Estimated Snowfall Rate |
Road & Visibility |
|
Light blue |
15-25 dBZ |
Light snow/flurries |
< 0.5 in/hr (<1.2 cm/hr) |
Minor impacts; roads stay mostly clear |
|
Dark blue |
25-35 dBZ |
Moderate snowfall |
0.5-1.0 in/hr (1.2 - 2.5 cm/hr) |
Reduced visibility; snow slush on roads |
|
Purple |
35-45 + dBZ |
Heavy/Intense snow |
> 1.0 - 2.0 + in/hr (>2.5 cm/hr) |
Hazardous driving; rapid snow accumulation |
|
Pink/Orange |
25-40 dBZ |
Freezing rain/ Sleet mix |
Variable (Ice Accumulation) |
Extreme hazards; high risk of black ice |
How to Read a Snow Radar Map on GoWeatherRadar
To read a snow radar map on GoWeatherRadar, select the Snow layer, use the color legend to check snowfall intensity, and hit Play to track storm movement.
Switch to ECMWF forecast views to predict future accumulation and combine wind or temperature layers for accurate planning.
Step 1: Select the Snow Layer
Open GoWeatherRadar, click Snow on the top menu to activate the snow overlay, and type your city or zip code into the search bar.
Zoom in or out to switch between local roads and a regional overview.
Step 2: Decode the Color Legend
Look at the map's color scale to judge snowfall rates:
-
Light Blue: Light snow or flurries with low accumulation.
-
Dark Blue to Purple: Moderate to heavy snow that reduces visibility and covers roads fast.
-
Pink / Orange: A dangerous mix of sleet, freezing rain, or ice pellets.
Step 3: Track Storm Movement
Click the Play icon on the bottom timeline bar to animate the past 1–3 hours.
Watch which direction the colored snow bands are moving and whether they are expanding (strengthening) or shrinking (fading).
Step 4: Switch to ECMWF Forecasts
Toggle from Live to Forecast mode to use ECMWF weather models. Slide the timeline forward to +6h, +12h, or +24h to see where snow will fall later in the day.
Step 5: Check Temperature & Wind
Turn on the Temperature layer to see if ground temperatures are below 0°C (32°F) to watch for black ice.
Add the Wind layer to spot potential blizzard or blowing snow hazards.
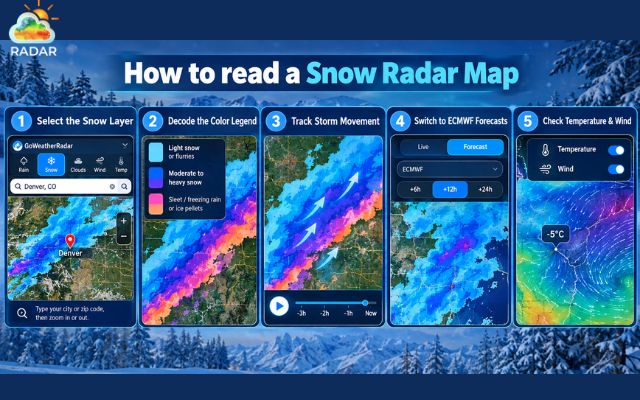
Detailed guide on how to read a snow radar map
Practical Applications: Why You Need a Live Snow Radar
Using a live snow radar map gives you a real-time, hyperlocal view of winter precipitation, allowing you to bypass generalized weather broadcasts and make proactive decisions before freezing conditions strike.
A live snow radar map provides real-time, hyperlocal tracking so you can make fast, proactive decisions during winter storms rather than relying on broad daily forecasts.
-
Safe Commuting: Check radar loops before driving to avoid purple heavy-snow bands, time your departure between storm surges, and spot pink sleet zones where roads freeze fast.
-
Smart Snow Removal: Track incoming precipitation to time shoveling or plowing shifts before heavy snow packs down and freezes.
-
Storm Readiness: Monitor official warnings alongside live radar to know exactly when high-intensity snow squalls will hit your neighborhood, giving you time to prepare.
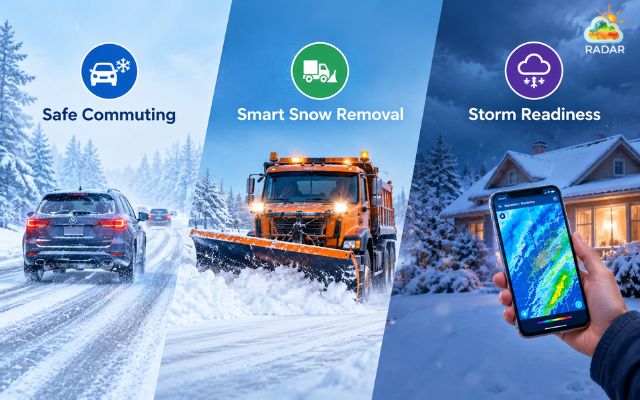
Utilize a snow radar map for safe winter travel, timely snow removal and storm prep
Final Words
Mastering a snow radar map is the smartest way to navigate unpredictable winter weather with total confidence. By reading color intensities, tracking live storm loops, and leveraging ECMWF forecast models, you can protect your daily commute and stay ahead of severe snowfall. Bookmark a reliable radar tool today and take control of your winter safety!


0 Comments
Leave a Comment
Your email address will not be published. Required fields are marked *