ECMWF Weather Model: What It Is & Why It Leads Global Forecasting
The ECMWF weather model leads global meteorology with up to 90% storm tracking accuracy. How do its algorithms power modern forecasting? Read our complete guide to learn how the European model works and track live weather on GoWeatherRadar today!
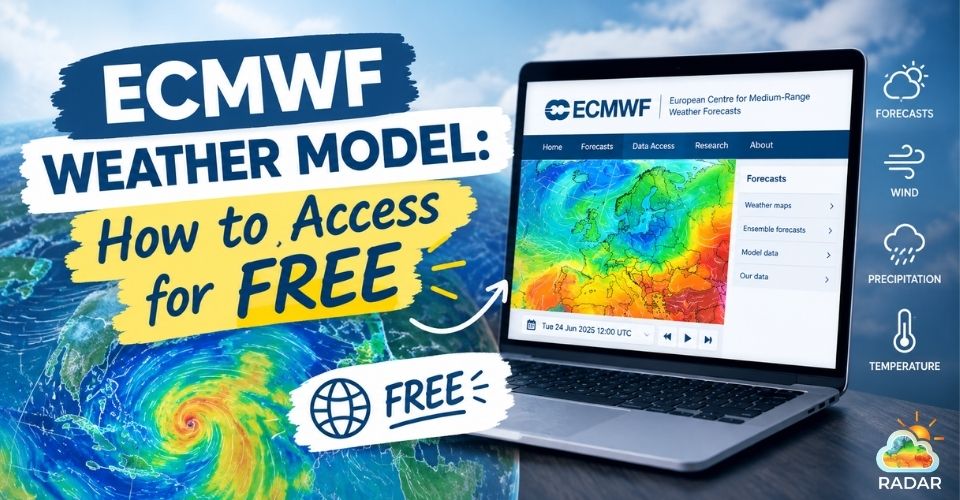
ECMWF Weather Model
What is the ECMWF Weather Model?
If you rely on weather apps to plan outdoor trips or track upcoming storms, you have likely benefited from the ECMWF weather model.
ECMWF stands for the European Centre for Medium-Range Weather Forecasts.
Supported by 35 member and co-operating states, this independent organization runs global weather models instead of focusing on local regional forecasts.
It processes billions of data points to forecast atmospheric changes across the entire planet.
The Integrated Forecasting System (IFS)
At the heart of ECMWF lies its flagship physics engine: the Integrated Forecasting System (IFS).
The IFS model uses fluid dynamics equations and live global observations to predict weather.
By gathering data from satellites, balloons, aircraft, and ocean buoys, it creates an accurate 3D map of the atmosphere.
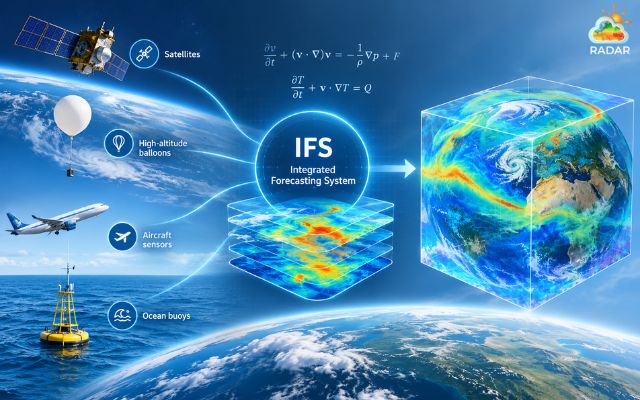
The IFS physics engine processes global satellite and environmental sensor data
Why Is It Considered the "Gold Standard"?
Meteorologists widely consider ECMWF the most accurate global weather model available.
Its reputation was cemented during major severe weather events, most notably Hurricane Sandy in 2012.
While competing models expected the storm to head out to sea, ECMWF correctly predicted its turn toward the US East Coast seven days early.
Its track record in forecasting tropical cyclones, jet streams, and temperature shifts makes it a preferred choice for weather experts everywhere
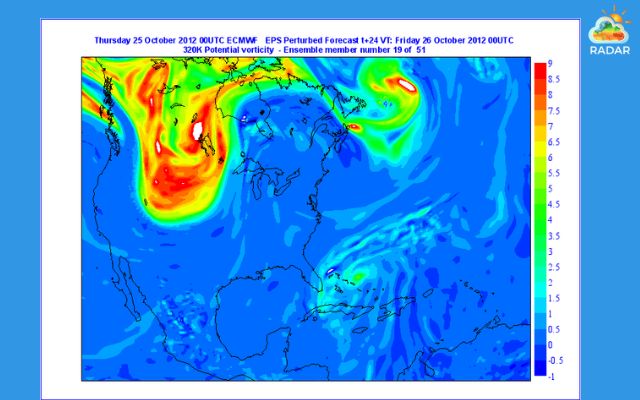
ECMWF forecast data on Hurricane Sandy 2012
Key Features of ECMWF & How it Works
The ECMWF model turns raw planetary data into accurate daily forecasts using four key technologies:
1. High-Resolution Deterministic Model (HRES)
Spatial resolution determines how finely a model views the Earth.
ECMWF’s High-Resolution (HRES) model divides the atmosphere into a grid spaced 9 kilometers apart.
This high detail helps it model complex terrain, coastal breezes, and mountain microclimates that other models often miss.
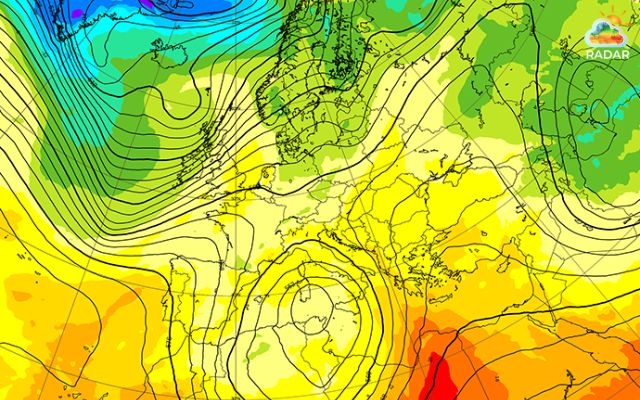
High-resolution 9km spatial grid capturing localized terrain and weather patterns
2. 4D-Var Data Assimilation
Most weather models take a static "snapshot" of current conditions before running calculations. ECMWF uses an advanced technique called Four-Dimensional Variational Data Assimilation (4D-Var).
Instead of taking a single snapshot, 4D-Var tracks how weather changes over time (3D space + time).
This continuous approach cuts initial errors and gives the model a much more accurate starting point.
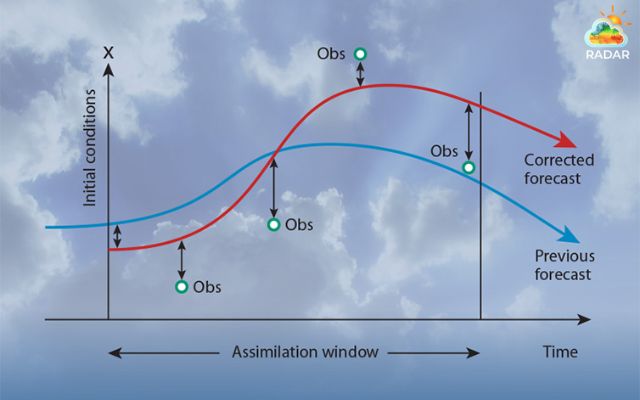
Continuous 4D-Var data assimilation syncing weather observations across space and time
3. Ensemble Forecasting System (ENS)
The atmosphere is chaotic. Tiny changes in temperature or pressure can completely change a long-range forecast.
To address this, ECMWF runs an Ensemble Prediction System (ENS).
Rather than running just one forecast, the ENS runs 51 separate simulations simultaneously. One run serves as the baseline control, while the other 50 introduce small variations in starting conditions.
If all 51 runs show a similar outcome, meteorologists can state with high confidence that a specific weather event will occur.
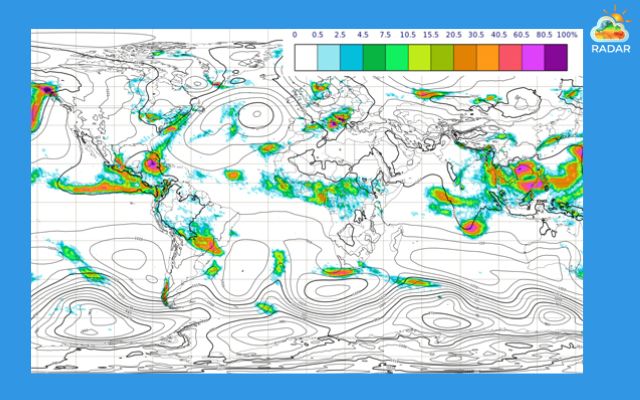
51 distinct ensemble simulations visualizing probabilistic weather scenarios
4. Artificial Intelligence Forecasting System (AIFS)
ECMWF recently launched its Artificial Intelligence Forecasting System (AIFS).
Instead of solving complex physics equations, AIFS uses deep learning trained on decades of climate data (ERA5).
It generates accurate 10-day global forecasts in seconds, providing a powerful, data-driven partner to traditional models.
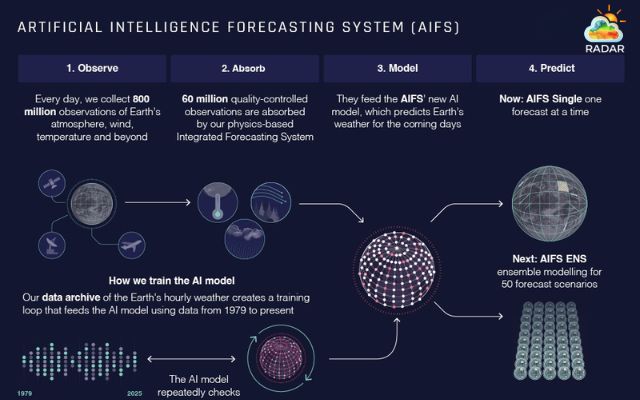
ECMWF launched its Artificial Intelligence Forecasting System (AIFS) (Source: ECMWF)
ECMWF vs GFS: Which Model is Better?
When comparing global weather models, ECMWF consistently outperforms the GFS in accuracy, storm tracking, and resolution.
While ECMWF is run by European researchers, the GFS is operated by NOAA in the United States.
GFS is famous for offering completely free, open-source data.
However, its coarser 13km grid and older data methods mean it often struggles with sudden storm changes and complex local terrain.
To see how these two powerhouse models compare side-by-side, check out the key breakdown below:
|
Feature |
ECMWF (European Model) |
GFS (American Model) |
|
Grid Resolution |
~9 km (Ultra-fine spatial detail) |
~13 km (Broader atmospheric grid) |
|
Data Assimilation |
4D-Var (Time + 3D space dynamic sync) |
3D-EnVAR (Simpler time windowing) |
|
Storm Track Accuracy |
Highest (Industry gold standard for typhoons/hurricanes) |
Moderate (Tends to over-predict or lag on turns) |
|
Update Frequency |
2 main runs/day (00 & 12 UTC) |
4 main runs/day (Every 6 hours) |
|
Accessibility |
Commercial & Open Data feeds |
Fully public domain (Free raw download) |
GoWeatherRader: Best ECMWF Weather Model
You can easily view ECMWF forecast data without dealing with complex files by using free tools like GoWeatherRadar.
Raw ECMWF data comes in massive numerical formats (GRIB2) that require specialized software to read.
GoWeatherRadar bridges this gap by turning raw data into an intuitive, interactive map - bringing professional weather forecasts right to your phone or browser.
What Is GoWeatherRadar?
GoWeatherRadar is a free, web-based platform engineered to deliver real-time rain radar.
It is considered the best weather radar website, combined with the predictive precision of the ECMWF forecast model.
You do not need to read dense weather charts. GoWeatherRadar lets you track live rain, wind, and temperature shifts right down to your neighborhood.
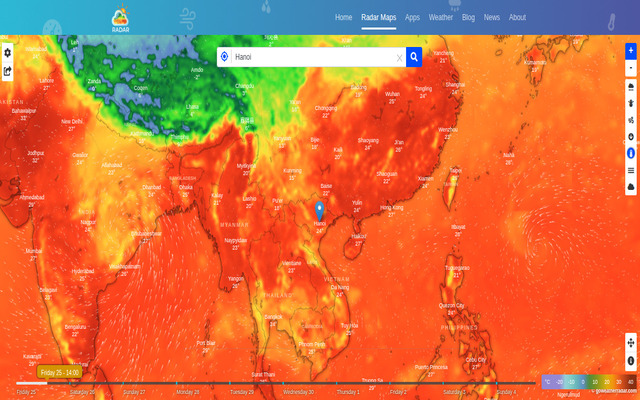
GoWeatherRadar incorporates the ECMWF weather model
Core Features of GoWeatherRadar
-
Live Weather Radar: Pan smoothly, zoom in to street level, and watch instant storm replays worldwide - 100% free.
-
Multiple Radar Layers: Switch easily between rain, cloud cover, air pressure, wind gusts, and temperature maps.
-
Customizable Settings: Personalize your view fast by changing units (°C/°F, mph/km/h) and adjusting map colors.
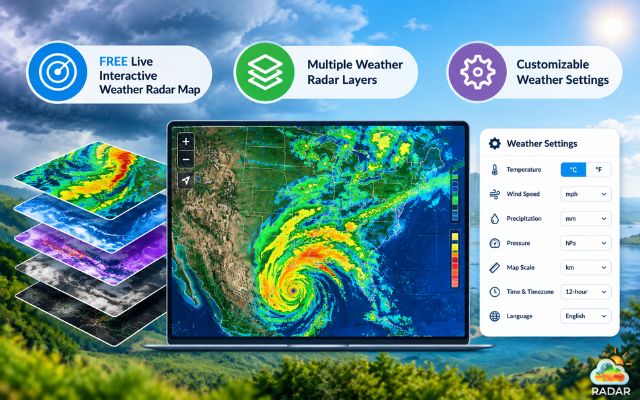
Main features of GoWeatherRadar
How to Use GoWeatherRadar: Step-by-Step Guide
Navigating GoWeatherRadar is straightforward, follow these steps to get the most out of the interactive map:
Step 1: Open the GoWeatherRadar Map and Find a Location
Navigating to goweatherradar.com and Choose “Radar Maps”.
-
Search via Top Search Bar: Look at the top center of the screen and type your city, zip code, or landmark into the Search Box to jump straight to your area.
-
Auto-Locate Button: Click the Target icon on the left side of the map to center on your current position using GPS.
-
Manual Map Controls: Click and drag the map to move around. Use the + and - buttons in the bottom right (or scroll with your mouse) to zoom in and out.
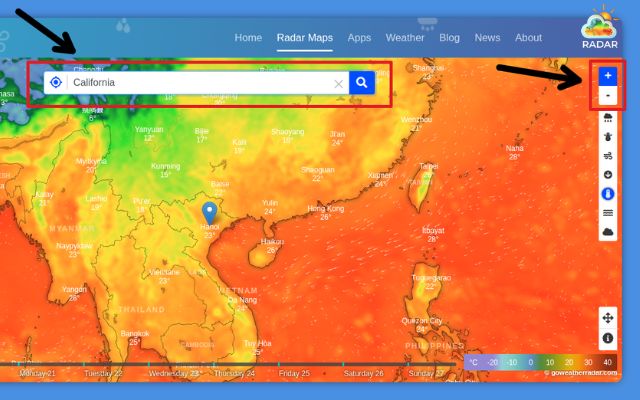
Locating your area on GoWeatherRadar using the top search bar or the auto-locate button
Step 2: Select a Weather Layer
To switch between different weather parameters, use the Layer Control Panel located on the right side of the screen:
-
Rain: View active rain, snow, or storm activity updating in real time.
-
Snow: Track winter precipitation zones, freezing levels, and live snowfall movement.
-
Wind: Display live airflow trajectories, wind speeds, and gust patterns.
-
Pressure: Check high and low-pressure systems driving weather fronts.
-
Temperature: Overlay thermal maps to visualize hot and cold air masses.
-
Humidity Layer: Check moisture levels, dew points, and humidity to gauge comfort and rain risk.
-
Clouds: Monitor overcast coverage, cloud density, and upper-atmosphere cloud movement.
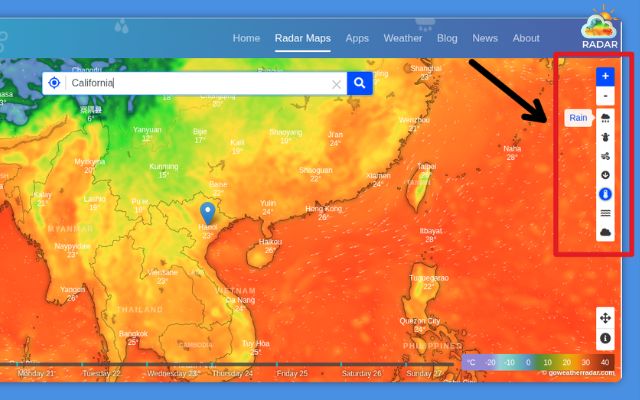
Choosing rain, snow, wind, or cloud layers from the right-hand panel on GoWeatherRadar
Step 3: Read the Map Colors, Symbols, and Scale
Once a layer is active, interpret the visual data using the Color Scale Bar anchored at the bottom edge of the screen:
-
Precipitation & Storms: Light green and blue show light rain. Yellow and orange mean moderate rain, while dark red and purple signal severe storms.
-
Snowfall Activity: Shades of light blue to bright purple highlight freezing rain and heavy snow.
-
Numerical Legend: Use the color scale at the bottom of the map to check exact rates for rain (mm/h) or wind (mph).
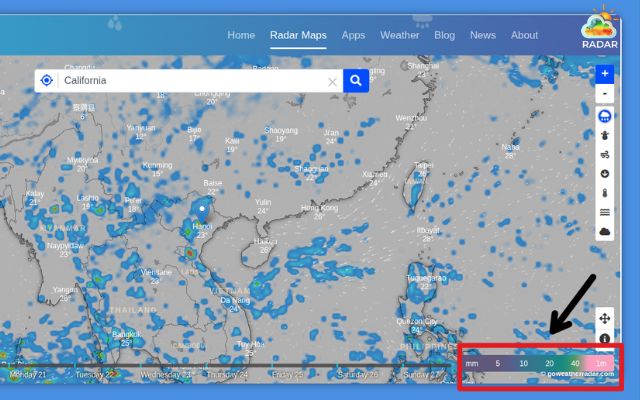
Interpreting rainfall rates using the color-coded legend bar at the bottom of the map
Step 4: Adjust Units, Time, and Map Settings
Customize display preferences by clicking the Settings Gear Icon in the top-right corner:
-
Set Units: Switch between metric and imperial scales for temperature (°C/°F), wind speed (km/h, mph, knots), rain accumulation (in, mm), snow (in, cm), pressure (hPa, inHg, mmHg), height (m, ft), distance (km, mi, NM)
-
Configure Time & Zone: Toggle between 12-hour and 24-hour clock formats, and sync the map to your local time zone.
-
Language: Choose your preferred language
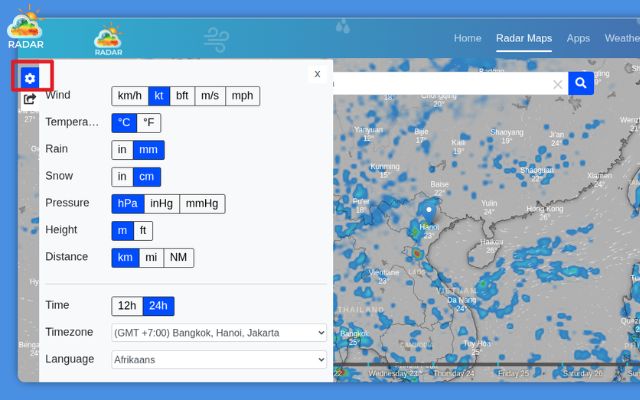
Customizing measurement units and time formats via the settings gear icon
Step 5: Switch Between Weather Conditions
Track real-time movement or project future conditions using the timeline bar.
-
Scrub Through Time: Drag the timeline slider forward to see forecast projections for the coming hours or days.
-
Instant Layer Switch: Swap between rain, wind, and temperature views with one click while staying on your map location.
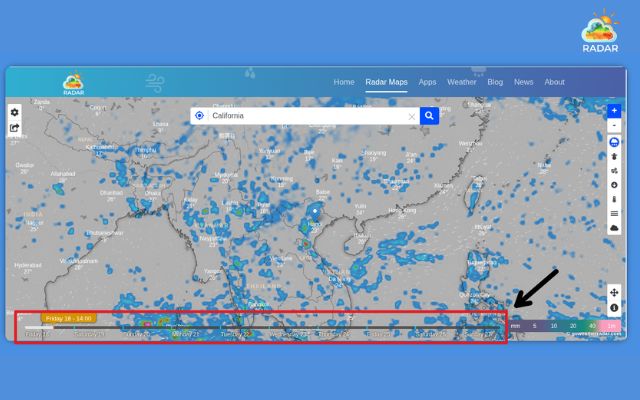
Using the bottom timeline bar on GoWeatherRadar to scrub through future forecasts
Sum up
The ECMWF weather model remains the gold standard in global forecasting, combining 4D-Var precision, high resolution, and AI technology. With GoWeatherRadar, you can easily track raw European data and monitor storms with confidence. Explore live radar maps today to stay one step ahead of changing weather!


0 Comments
Leave a Comment
Your email address will not be published. Required fields are marked *