Pressure Radar Map: Isobars, High/Low Systems, and How to Read Them
A pressure radar map combines air pressure data with live rain radar to predict severe storms with over 90% accuracy. Learn how to read these key weather layers on GoWeatherRadar today to track wind, spot changing weather, and stay ahead of the storm. Diving in!
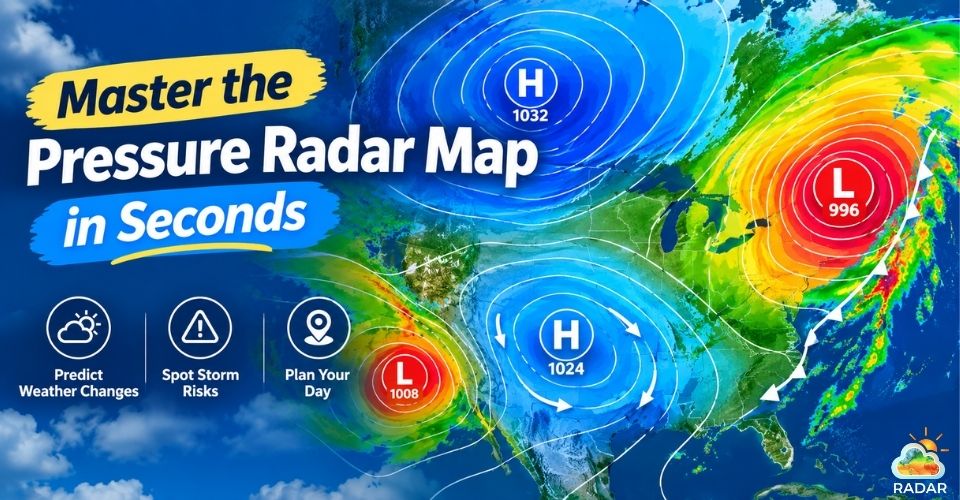
A pressure radar map is used to track atmospheric pressure
What is a Pressure Radar Map
A pressure radar map is an interactive tool that combines air pressure data with live rain and snow radar.
Instead of just showing where it is raining or snowing right now, this map reveals the hidden air movements pushing the weather along.
In simple terms, a pressure radar map brings together two main technologies:
-
Barometric Pressure Layer: Displays atmospheric weight across the surface. It uses contour lines (isobars) and pressure centers to reveal macro-scale weather drivers.
-
Weather Radar Layer: Emits radio waves that bounce off precipitation particles. It highlights active rain, snow, or hail in vibrant color gradients (green, yellow, red).
While Doppler radar shows what is happening right now, surface pressure data explains why it is happening and where the storm will head next
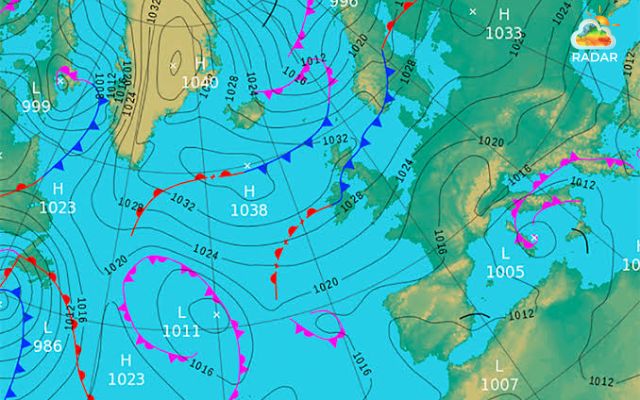
Pressure radar map combines barometric pressure and weather radar layer
How Pressure Radar Maps Work
Modern digital maps process vast amounts of environmental data every second. The system functions through a seamless three-step loop:
-
Data Collection: Ground-based automated weather stations and barometers measure local atmospheric pressure. At the same time, weather satellites and ground radar towers scan the skies for precipitation.
-
Supercomputer Modeling: Advanced numerical weather prediction models analyze these raw data streams. They calculate pressure gradients and smooth them into continuous surface lines.
-
Visual Mapping Render: Interactive platforms process these calculations into a clean graphic map. Isobars and weather fronts are drawn instantly over colored radar sweeps.
Understand the Pressure System
Daily weather depends heavily on the pressure system. To read it, you simply look at how air density, isobar lines, and weather fronts interact with each other.
Atmospheric pressure is simply the force exerted by the weight of air molecules above a specific location.
Differences in air pressure drive wind patterns and form the foundation of all short-term weather forecasts.
High and low pressure systems
Air always flows from regions of higher density to regions of lower density. This continuous balance creates two primary atmospheric engines:
High Pressure Systems (H)
-
Atmospheric Motion: Cool, dense air slowly sinks toward the Earth's surface.
-
Resulting Weather: Sinking air suppresses cloud formation. This brings clear skies, light winds, dry conditions, and generally calm, pleasant weather.
Low Pressure Systems (L)
-
Atmospheric Motion: Warm, light air rises rapidly away from the surface.
-
Resulting Weather: As air rises, it cools and condenses into clouds. This creates unsettled conditions, rain, thunderstorms, and intense winds.
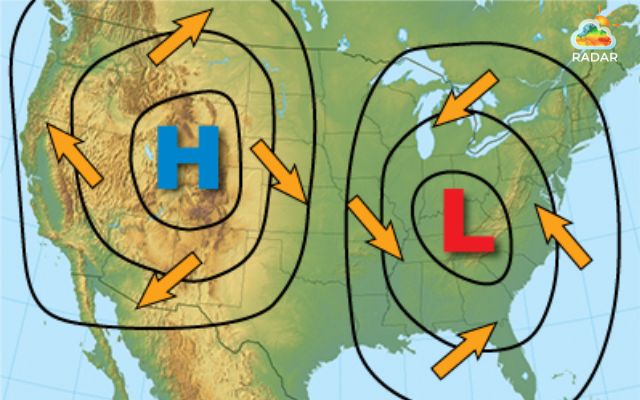
High and low pressure on a pressure radar map
Isobars
Isobars are the thin, continuous lines visible on every surface pressure map.
These lines connect points on a map that have the exact same air pressure at sea level, measured in millibars (mb) or hectopascals (hPa).
Isobar Spacing & Wind Strength: The distance between lines indicates wind velocity.
-
Tight spacing: Represents a steep pressure gradient, signaling high winds and rapid weather shifts.
-
Wide spacing: Represents a gentle pressure gradient, indicating calm winds and stable conditions.
Wind Direction Flow: Wind does not blow in a straight line from High to Low due to the Earth's rotation (Coriolis Effect).
-
In the Northern Hemisphere, wind circulates clockwise out of Highs and counter-clockwise into Lows.
-
In the Southern Hemisphere, this rotation direction reverses.
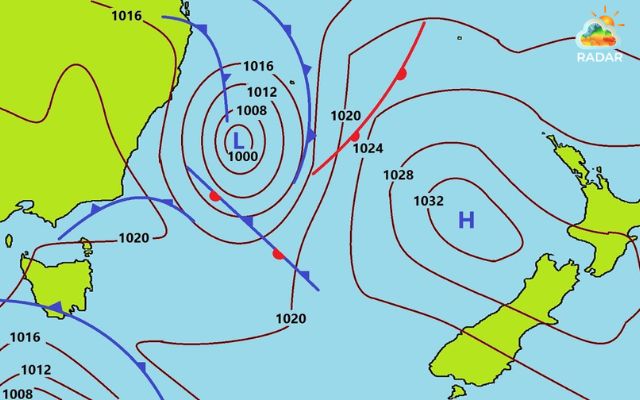
Isobars on a pressure radar map connect points of equal air pressure
Weather fronts
Weather fronts mark the boundary zones where two contrasting air masses meet. These boundaries typically extend outward from Low-pressure centers.
|
Front type |
Map Symbol |
Weather Impact |
|
Cold Front |
Blue line with solid blue triangles pointing toward motion |
sudden rain showers, strong wind gusts, and sharp drops in temperature |
|
Warm Front |
Red line with solid red semicircles pointing toward motion |
Steady, long-lasting rainfall followed by warmer, humid weather |
|
Stationary Front |
Alternating blue triangles and red semicircles on opposite sides |
Several days of cloudy skies and continuous light-to-moderate rain |
How to Read a Pressure Radar Map on GoWeatherRadar
GoWeatherRadar makes reading a pressure map simple. You don't need to decipher complex isobar lines or search for H and L symbols.
Instead, the map translates atmospheric pressure directly into a clear, color-coded visual layer.
Simply match the map's colors with the bottom-right scale to check air pressure and predict changing weather instantly.
Step 1: Open GoWeatherRadar & Select the Pressure Layer
Go to GoWeatherRadar.com (or open the app) and navigate to the interactive map. On the right-hand Layer Control Panel, click on Pressure.
The map immediately highlights live air pressure across your region using clear, distinct colors.
Step 2: Check the Color Scale Legend
Look at the numerical color scale bar anchored in the bottom-right corner of the screen.
This bar links each color to exact air pressure values, which you can set to hPa, inHg, or mmHg:
-
Purples, Blues & Cyan: Indicate lower atmospheric pressure zones (unsettled, cloudy, or stormy weather).
-
Greens, Yellows & Reds: Indicate higher atmospheric pressure zones (stable, clear, and dry weather).
Step 3: Identify Local Pressure by Matching Colors
Pan and zoom the map to your location. Compare the dominant color covering your area with the bottom-right scale:
-
Darker/Cooler Hues (Purple/Blue): Show air pressure below average (~1013 hPa), signaling incoming clouds or rain.
-
Warmer Hues (Yellow/Red): Show rising pressure above normal levels, confirming fair and clear skies.
Step 4: Cross-Reference Pressure Colors with Live Radar
Combine pressure color trends with precipitation layers.
Toggle or cross-reference the Rain or Cloud layer from the right-side panel.
You will see live rain radar sweeps (green, yellow, and red) clearly matching the blue and purple low-pressure areas on the map.
Explore more
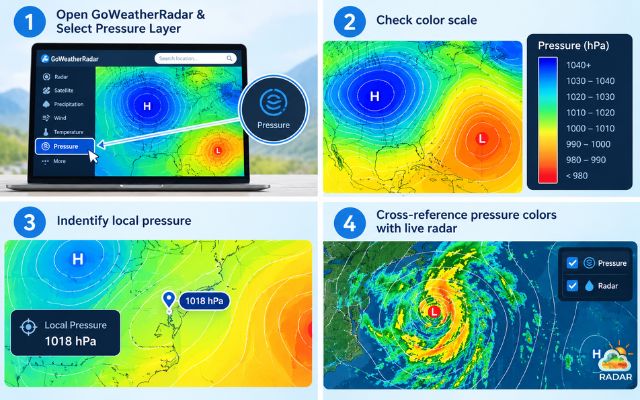
Easily check the pressure radar map on GoWeatherRadar
How to Track Pressure Changes Over Time
Observing how pressure colors shift over time helps you predict weather changes hours before they arrive.
-
Use the Bottom Timeline Bar: Click or drag along the date and hour markers at the bottom of the map to view hourly forecasts.
-
Falling Pressure (Green/Yellow Blue/Purple): Signals dropping air pressure. Expect worsening weather, increasing cloudiness, and incoming rain within 6 to 12 hours.
-
Rising Pressure (Purple/Blue Yellow/Red): Signals rising air pressure. Expect clouds to clear and weather to improve.
-
Speed of Change: Fast-moving colors on the timeline signal a quick weather front with strong winds.
Sum up
Mastering a pressure radar map is the ultimate way to stay ahead of changing weather conditions. By tracking high and low pressure systems on GoWeatherRadar alongside live precipitation layers, you can read wind patterns and predict storms with confidence. Explore the interactive map today to plan your outdoor activities safely!


0 Comments
Leave a Comment
Your email address will not be published. Required fields are marked *